Most founders cannot tell you which DNA they actually have. Their CRM team thinks one thing. Their paid team thinks another. The cohort curve already knows the answer.
Four types of brand DNA. Three are businesses. The fourth is what most founders are running. They just haven't looked.
The four shapes of brand DNA
The DNA of a brand is visible in its cohort revenue chart. Not in the P&L. Not in the dashboard. The curve is honest about what kind of business you are even when the founder isn't.
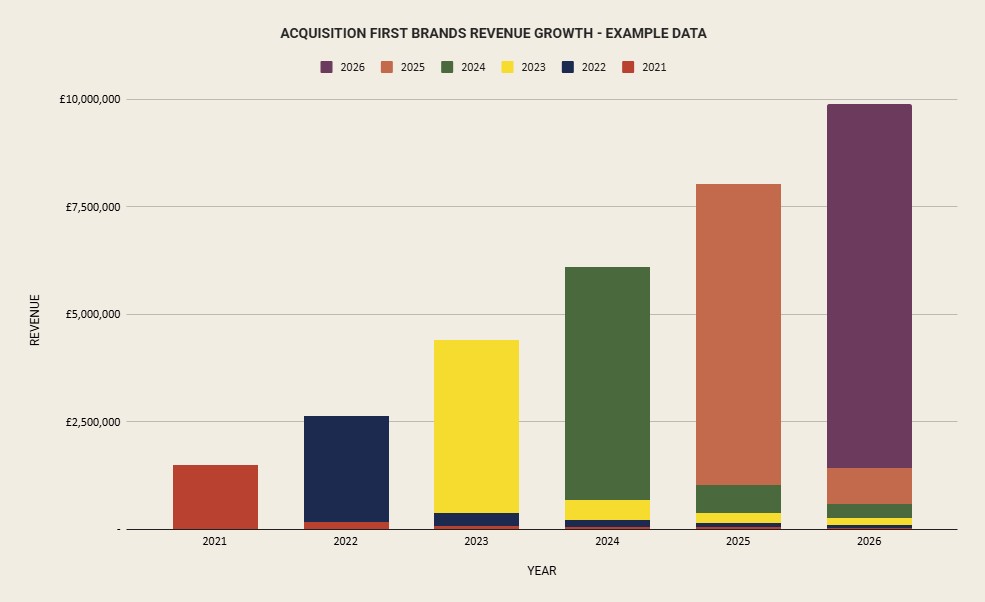
Acquisition-led brands like Ridge Wallet and Simple Modern are built around the first order. Hero product, strong margin, cold traffic that converts. The cohort curve tells the truth. A sharp spike at month zero, then a fast drop, then a thin tail that flattens out. Most of what the customer ever spends with you, they spend in the first thirty days. Stack every cohort on the same chart and you see a row of mountains with almost nothing underneath. Revenue is a series of acquisition events, not a compounding base. The line only goes up if the spend does.
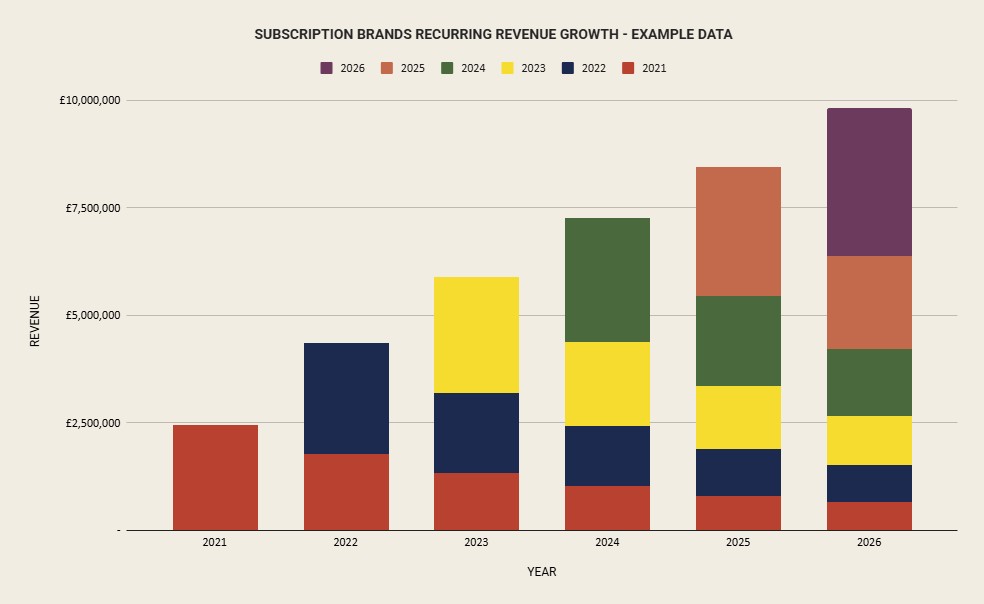
Retention-led brands like Simmer Eats, Fresh Fitness Food, Years and Butternut Box are built around the second order. And the third. And the twelfth. The cohort curve looks different. A more modest spike at month zero, then a tail that holds. Sometimes it even rises in months two and three as add-ons and upgrades come in. Each cohort keeps paying for months or years. Stack them and you see layered blocks. The base under the spikes is the business. Compounding has a shape, and this is it.
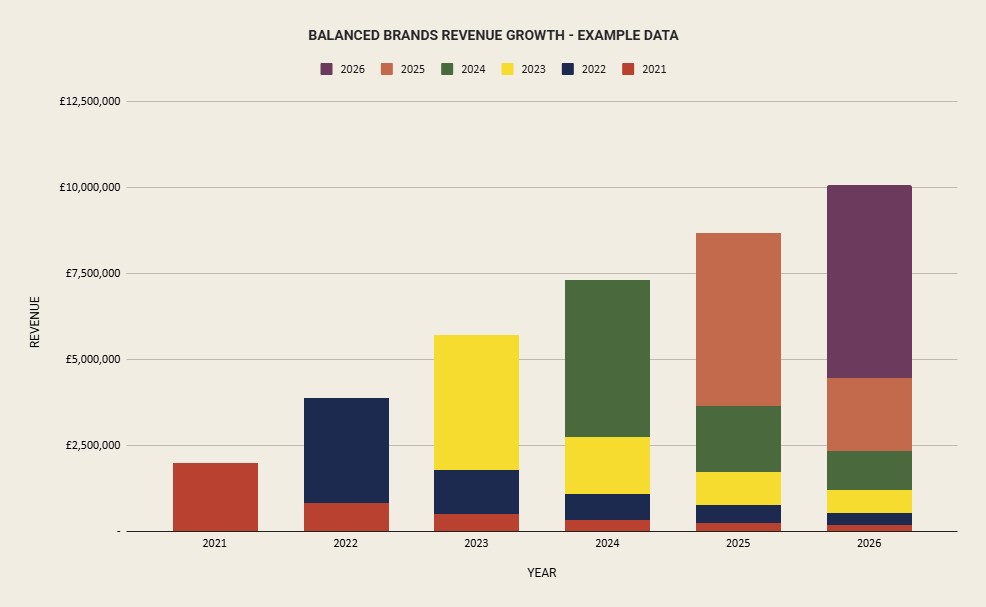
The mixed model lives between the two. Finisterre. Passenger. Patagonia. Strong brand love drives repeat, but the cycle is annual, not weekly. The customer buys a jacket. They come back next winter for another one. Maybe a tee in between. The cohort curve has both shapes pulling on it: a meaningful spike at month zero, then a tail that doesn't disappear but doesn't dominate either. Stack the cohorts and you see both. Visible spikes. Visible base. Harder to draw because it's a real business making real trade-offs.
The fourth chart looks like one of the other three for a while. The spike is there. The tail looks normal. The top line is even growing. Underneath, the cash is moving faster than the model assumed it would.
Then the tail doesn't behave the way the founder expected. The retention that was meant to earn back the first-order loss doesn't show up at month three. Or month six. Or month twelve. By the time the chart confirms what the cash has been saying for months, the business has been wrong on two timescales at once. Burning short term. Mispriced long term.
[insert image - cohort curve, undecided: starts looking like one of the other three shapes for the first 6-9 months, then the tail collapses below where the model assumed it would land. Stacked-cohort view should show the deterioration getting visible cohort-on-cohort, so the reader can see the decay accelerating. Optional: a faint dashed line showing where the model assumed the tail would be, so the gap between assumption and reality is visible]
The fourth isn't a different type. It's a brand that ran the wrong unit economics for what its cohorts were actually doing. The cash burns first. The chart confirms it later.
Acquisition-led: every order must pay
Acquisition-led brands have already looked at their cohort data and made peace with what it told them. The customer is not coming back enough to fund the model. The value that matters is captured at the first transaction. Everything is priced from there.
The unit economics target is profit on order one, after returns, fulfilment, payment fees and a contribution to overhead. Not break-even with hope. Not "we'll earn it back in cohort three." Profitable on day one or the maths doesn't work.
Retention isn't going to bail you out. The customer might not come back. If they do, it might be 18 months from now, and by then the cohort has lost too much value to be worth pricing against. The model assumes order one is the whole relationship. Anything more is upside.
This is why Ridge Wallet built their business around AOV. The model lives in the add-ons. Bundles, carabiners, money clips, pens, knives. They turn a £45 wallet into an £85 basket. A higher basket at the same gross margin raises the allowable CAC, opening audiences and channels that didn't maths before. The same paid social ad that loses money against a £45 order is profitable against an £85 one. Merchandising is a CAC lever pretending to be a product decision.
The model has a ceiling. Eventually the basket stops moving. Sean Frank has been open about what happened next at Ridge. The way out wasn't a clever CRM play. It was more product, more often. Weekly drops, new categories, new SKUs. If the customer isn't coming back for the same thing, give them five new things to come back for. Pure acquisition-led brands either become product businesses with frequent launches, or they stall.
[insert image - Ridge product expansion timeline showing the move from wallets into knives, pens, accessories etc, with weekly drop cadence visible. Could pair with AOV growth over time to show the basket-building effect]
This model demands a brand that is world-class at marketing. Not "we run paid ads" marketing. The craft version. Paid media run as a discipline, creative iteration run as a system, performance marketing that connects spend and revenue close to real time. Product that converts a stranger from a cold scroll. Positioning that justifies the price in three seconds. The founder is hiring marketers first, last and always.
The cash profile reflects all of it. Working capital fills the gap between media spend and revenue, and that gap compresses fast when CPMs rise. Platforms are an existential threat. One algorithm change can move CAC by 30% in a quarter, and the business has to absorb that shock without retention to fall back on. Predictability is low. Capacity to spend is high.
The founder has to accept what that means. Revenue tracks spend. Pause the spend, growth pauses. Retention is a bonus, not a strategy. Growth beyond the current product line means more product, more often. You become an operator of a launch machine, not a tender of an existing range.
The trap is running this model without the marketing depth to survive it. Brands that go acquisition-led with one channel, one agency, one creative concept get killed by CAC the first time the platform changes the rules. The model demands an acquisition engine that can flex. Without it, the brand is one Meta update away from the cash running out.